
Is MedChances accurate?
We are frequently asked: “how accurate are your predictions?” In this post, we hope to provide you with some transparent and quantitative answers to that question. We have broken this article into three parts: first, we walk through a brief explanation of our machine learning approach; second, we look at a global view of our predictions’ accuracy; and third, we explain our per-model accuracy metrics.
Background on our approach
We have employed machine learning approaches to build our predictive algorithms. Machine learning is a form of artificial intelligence in which the computer learns from observational data, figuring out its own solution to the problem at hand. In our case, the observational data (i.e. the training data) include admissions data from over 80,000 applications. The computer builds predictive models, by identifying patterns of students who were accepted versus those who were rejected. These models can then determine the probability of your admission to a given medical school, by comparing your data to the patterns it identified in the observational data (these are the probabilities displayed in the “my schools” table).
Global accuracy of our predictions
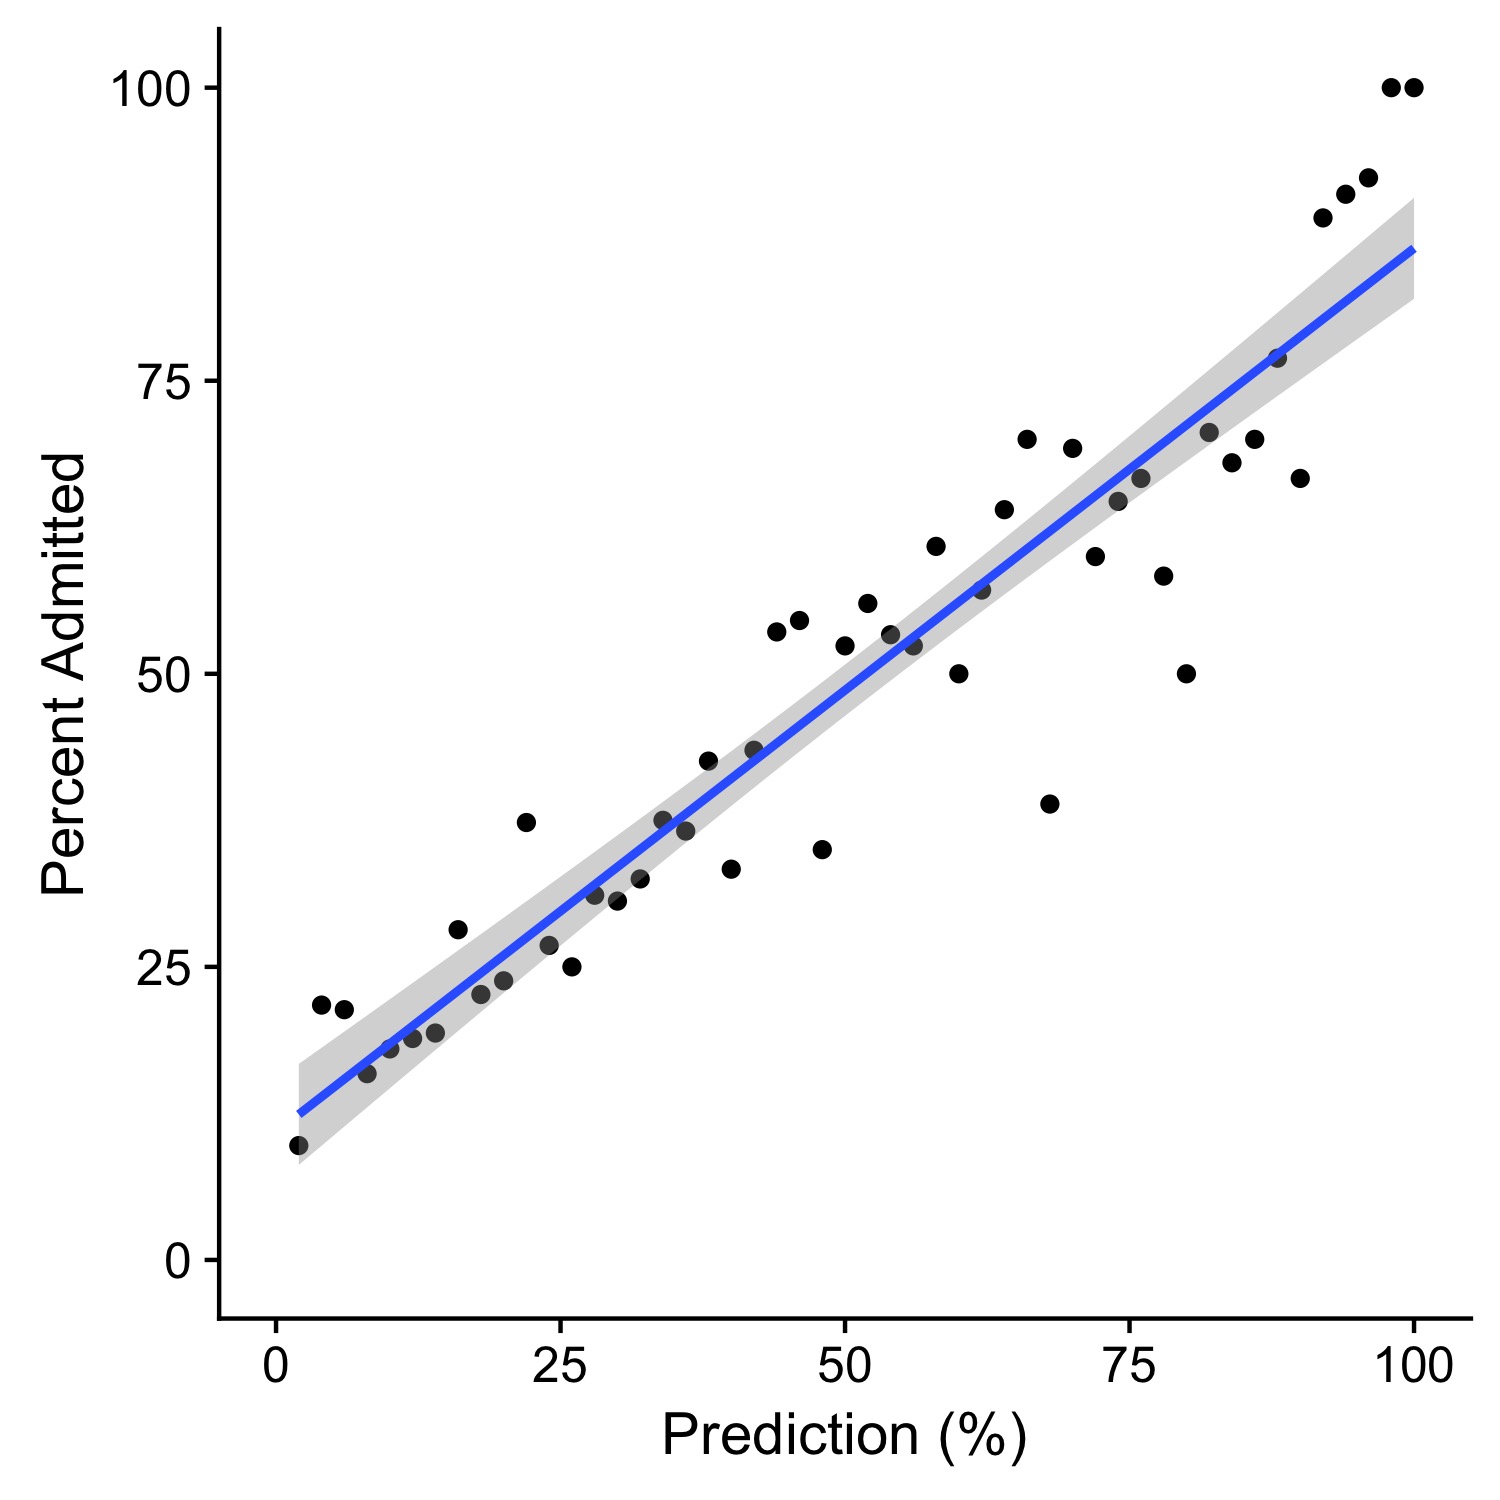
Since launching in January of 2018, MedChances has acquired over 5,000 users and we have generated over 50,000 admissions predictions. We decided to examine how well our predictions panned out for these users. A good model should work like this: say that there are 100 people who each have a 25% chance of getting accepted to a given medical school. If the model performs well, then roughly 25 out of 100 people should get in. If the model does not perform well, then the percentage of admitted students will deviate far from the predicted percentage.
On the right, we plotted the predictions on the x-axis and percentage of admitted students on the y-axis. As you can see, there is a strong linear relationship between our predictions and the percentage of people admitted (Pearson’s r = 0.94). This means that, overall, MedChances is extremely accurate in predicting admissions chances.
Per-school accuracy metrics
In the previous section, we evaluated how well our models performed in aggregate. But, if you have used MedChances to generate admissions predictions, you probably noticed there is a column labeled “accuracy” next to each individual medical school. The accuracy metric is intended to give you a sense of how well our predictions perform for that particular school. The higher the accuracy value the more accurate the model is, with a value of 1 indicating that our predictions for that medical school are highly accurate.
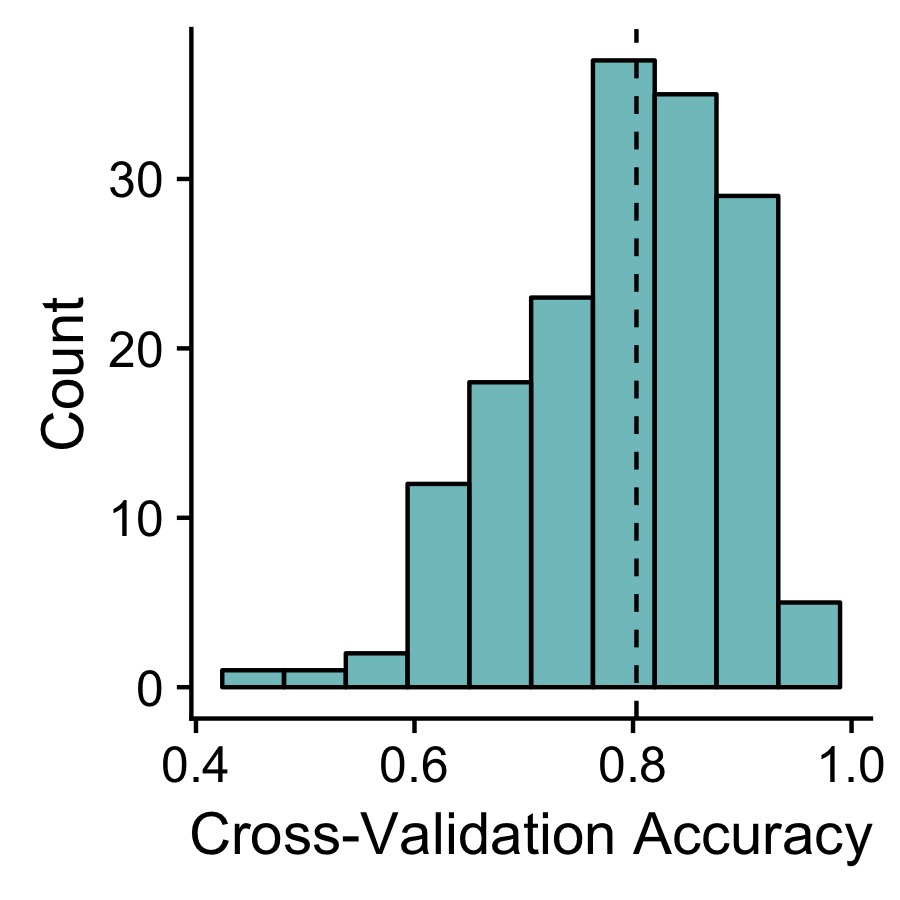
In order to gauge accuracy, we use an approach called cross-validation. In brief, we break the admissions data for a given school into 10 chunks. We then train our models on 9 of those chunks and test how often the model makes the correct predictions for the remaining 1 chunk. We repeat this process 10 times and report the average accuracy across these repetitions.
As you can see, the median accuracy is 81%. Overall, our models are quite accurate but there is some model-to-model variability in performance. Our lowest models tend to be the ones for which we have the least amount of data. Therefore, as our userbase continues to grow, we expect these values to increase.
Good luck with your applications! We hope MedChances can help you prioritize your school list and maximize your chances for admittance. As always, feel free to e-mail us with your thoughts, questions, or concerns.